As an amateur age group triathlete – and someone who’s a bit obsessed with data – I often find myself scouring through the results section of my races to see how I went compared to my peers, and, importantly, how far off I am from doing better.
So I wanted to take a quick look to see if I could make some pretty graphs from a sprint triathlon I did last weekend.
Data
So I can grab the data off the race website, and I’ll grab all the results. This is super slow and inefficient since I need to get around the anti-scraping rules, so I set it up to cache locally. I’m only grabbing the results from my age group as well to keep it small.
Code
import requestsfrom bs4 import BeautifulSoupimport reimport pandas as pdimport time, random, os, jsonDATA_FILE ="race_results_cache.json"HEADERS = {"User-Agent": "Mozilla/5.0 (Windows NT 10.0; Win64; x64) AppleWebKit/537.36 (KHTML, like Gecko) Chrome/122.0 Safari/537.36","Accept-Language": "en-AU,en;q=0.9","Referer": "https://www.multisportaustralia.com.au/"}session = requests.Session()session.headers.update(HEADERS)def safe_get(url, retries=5):for i inrange(retries): r = session.get(url, timeout=20)if r.status_code ==429: time.sleep(10+ i *5)continue r.raise_for_status()return rraiseException(f"429 block not resolved: {url}")def extract_tables_to_dfs(link): response = safe_get(link) soup = BeautifulSoup(response.text, "html.parser") tables = soup.find_all("table") dfs = []for table in tables: rows = table.find_all("tr") table_data = [] max_cols =0for row in rows: cells = row.find_all(["th", "td"]) row_data = [cell.get_text(strip=True) for cell in cells] max_cols =max(max_cols, len(row_data)) table_data.append(row_data)ifnot table_data:continue normalized_data = [ row + [""] * (max_cols -len(row)) for row in table_data ]ifall(cell !=""for cell in normalized_data[0]): header = normalized_data[0] data = normalized_data[1:]else: header = [f"col_{i}"for i inrange(max_cols)] data = normalized_data df = pd.DataFrame(data, columns=header) dfs.append(df)return dfsdef scrape_and_cache_json(): url ='https://www.multisportaustralia.com.au/races/2xu-triathlon-series-2526-race-4-sandringham-2026/events/3/category/Male/16' path ='/races/2xu-triathlon-series-2526-race-4-sandringham-2026/events/3/results/individuals/' base_url ='https://www.multisportaustralia.com.au' response = safe_get(url) soup = BeautifulSoup(response.text, 'html.parser') links = [] pattern = re.compile(r'^'+ re.escape(path) +r'\d+$')for a in soup.find_all('a', href=True):if pattern.match(a['href']): links.append(base_url + a['href']) results_json = {}for link in links: time.sleep(random.uniform(2.5, 6.0)) athlete_id = link.split('/')[-1] dfs = extract_tables_to_dfs(link) race_dfs = [df[["Location", "Race Time"]] for df in dfs if'Race Time'in df.columns]ifnot race_dfs:continue full_df = pd.concat(race_dfs, ignore_index=True)# ---- DataFrame -> JSON ---- race_json = full_df.to_dict(orient="records") results_json[f"athlete_id_{athlete_id}"] = race_jsonifnot results_json:raiseException("No data scraped")withopen(DATA_FILE, "w", encoding="utf-8") as f: json.dump(results_json, f, indent=2, ensure_ascii=False)return results_json# ---------- ENTRY POINT ----------if os.path.exists(DATA_FILE):withopen(DATA_FILE, "r", encoding="utf-8") as f: results = json.load(f)else: results = scrape_and_cache_json()print(f'{len(results)} results loaded')
40 results loaded
And if we want to see my result:
Code
bib_number =735result = results[f'athlete_id_{bib_number}']print("| Location | Race Time |")print("|--------------|-----------|")for entry in result:print(f"| {entry['Location']:<12} | {entry['Race Time']} |")
And I’m happy to say, I’m slightly above average !!! Massive win we, can end here. Besided this great news, I’m also a bit interested in how people are splitting their time between the diciplines. I’ve always seen myself as an average swimmer, a good cyclist, a poor runner and good in the transitions so lets see if that plays out in the data.
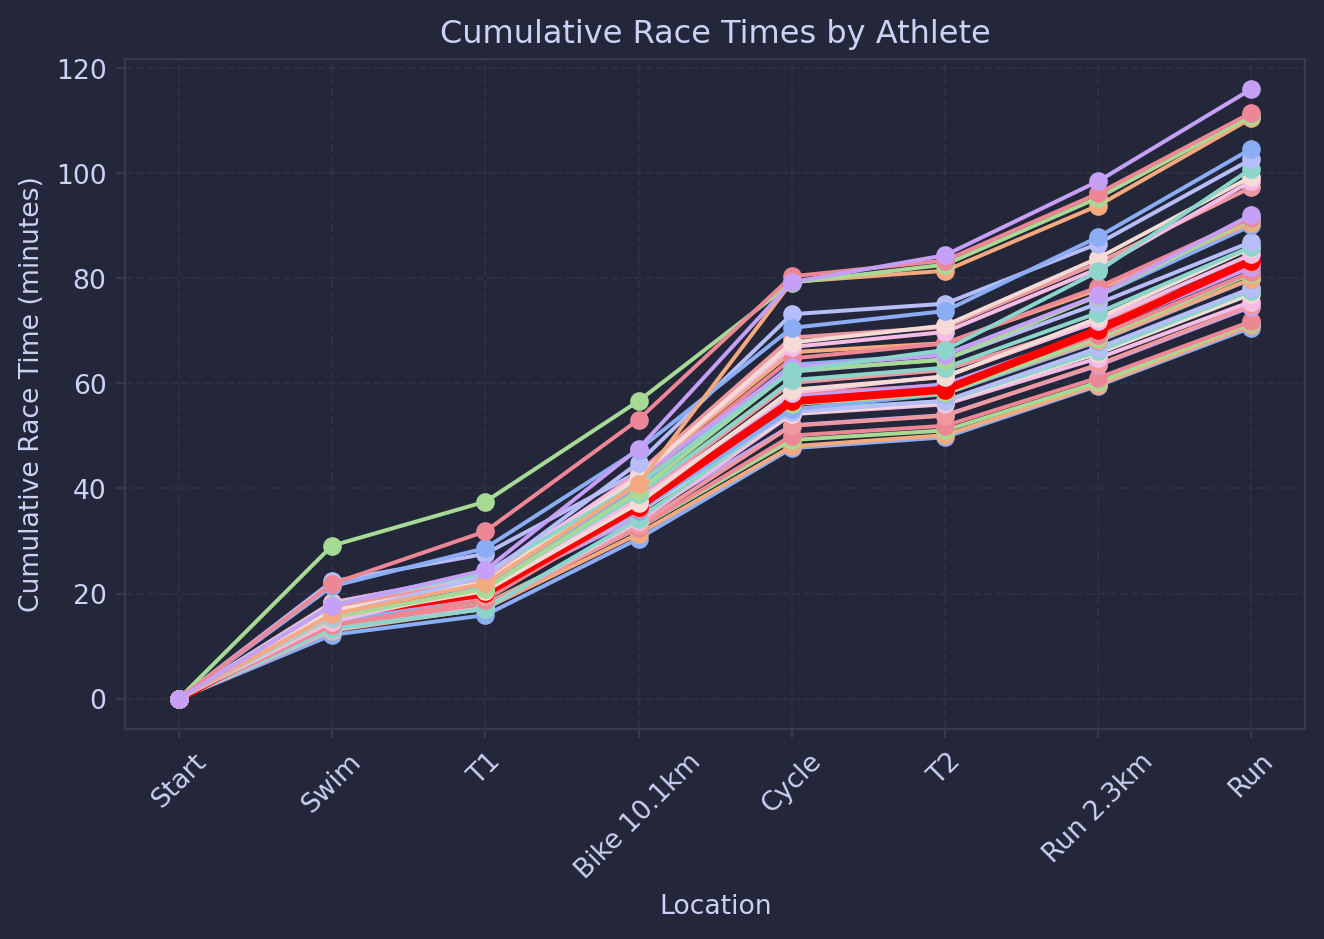
We can firts look at this by looking at the cumlative race times, with my time in red:
Code
from datetime import timedeltaimport matplotlib.pyplot as pltimport catppuccinimport numpy as npimport matplotlib as mplmpl.style.use(catppuccin.PALETTE.latte.identifier)# robust conversion: HH:MM:SS → minutesdef to_mins(t):ifnot t ornotisinstance(t, str):returnNone t = t.strip() parts = t.split(":")iflen(parts) !=3:returnNonetry: h, m, s =map(int, parts)return (h*3600+ m*60+ s) /60exceptValueError:returnNone# target athletetarget_id =f"athlete_id_{bib_number}"# X-axis order (from first athlete)locations = [entry["Location"] for entry innext(iter(results.values()))]plt.figure()for athlete_id, splits in results.items():# convert to dict for convenience loc_time_dict = {entry["Location"]: to_mins(entry["Race Time"]) for entry in splits}# skip incomplete athletesifany(loc notin loc_time_dict or loc_time_dict[loc] isNonefor loc in locations):continue times_min = [loc_time_dict[loc] for loc in locations]# highlight target athleteif athlete_id == target_id: plt.plot(locations, times_min, marker='o', linewidth=3, color='red')else: plt.plot(locations, times_min, marker='o', linewidth=1.5,)# formattingplt.xlabel("Location")plt.ylabel("Cumulative Race Time (minutes)")plt.title("Cumulative Race Times by Athlete")plt.xticks(rotation=45)plt.grid(True, linestyle='--', alpha=0.5)plt.tight_layout()plt.show()
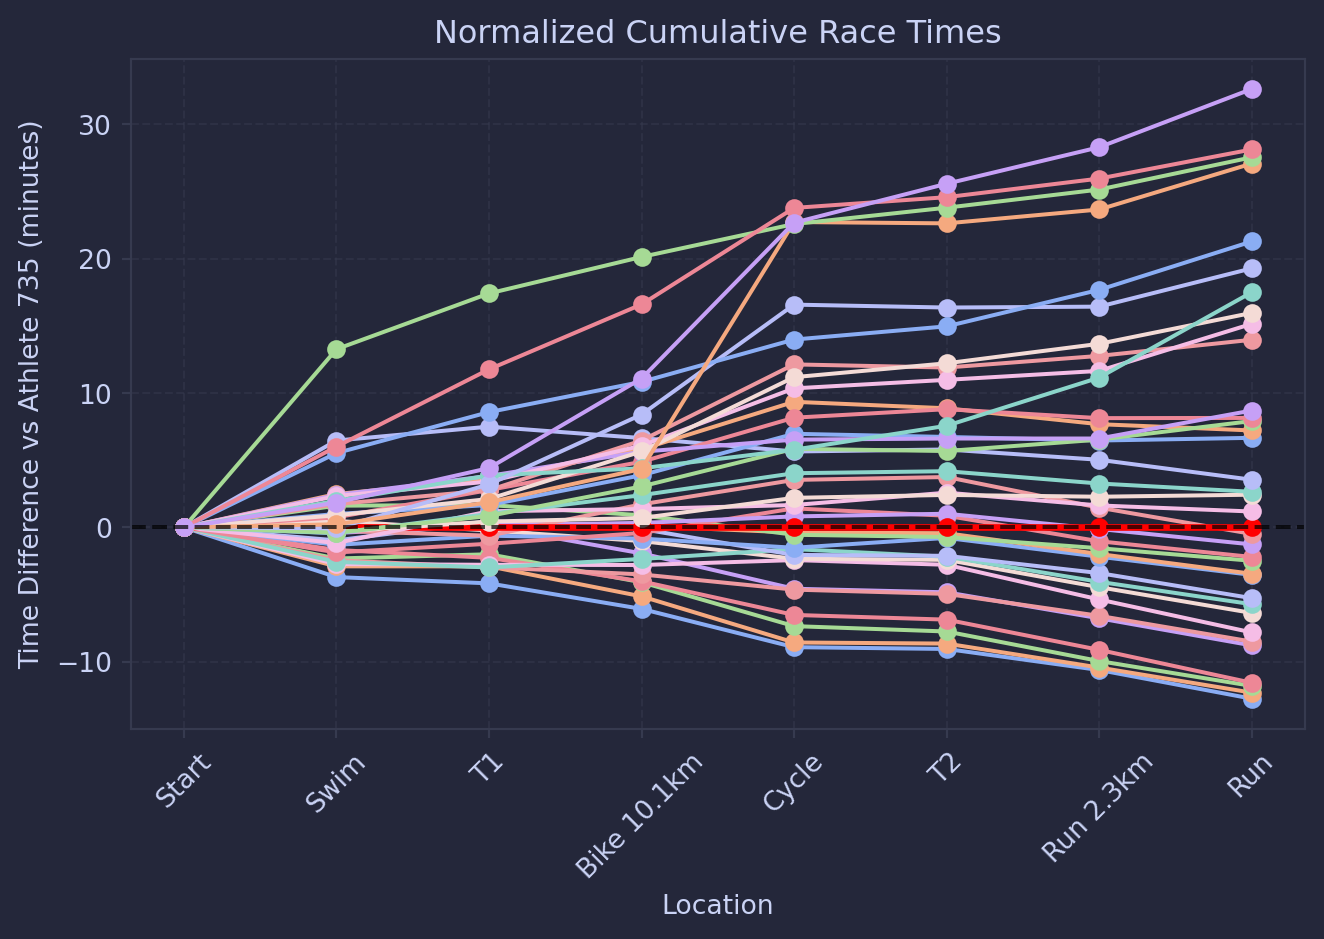
This doesn’t tell us much, so maybe we can look at the normalised times compared to me:
Code
target_id =f"athlete_id_{bib_number}"target_splits = results.get(target_id)ifnot target_splits:raiseValueError(f"Athlete {target_id} not found")# convert target athlete times to secondstarget_dict = {entry["Location"]: to_seconds(entry["Race Time"]) for entry in target_splits}ifany(loc notin target_dict or target_dict[loc] isNonefor loc in locations):raiseValueError(f"Target athlete {target_id} does not have complete data")target_times = [target_dict[loc] for loc in locations]plt.figure()for athlete_id, splits in results.items():# convert athlete times to seconds loc_time_dict = {entry["Location"]: to_seconds(entry["Race Time"]) for entry in splits}# skip athletes with missing timesifany(loc notin loc_time_dict or loc_time_dict[loc] isNonefor loc in locations):continue times_sec = [loc_time_dict[loc] for loc in locations]# normalize: subtract target athlete's times times_norm = [(t - t_target)/60for t, t_target inzip(times_sec, target_times)] # minutes plt.plot(locations, times_norm, marker='o', label=athlete_id, linewidth=1.5if athlete_id != target_id else2.5, color='red'if athlete_id == target_id elseNone)plt.axhline(0, color='black', linestyle='--', alpha=0.7) # baseline at targetplt.xlabel("Location")plt.ylabel("Time Difference vs Athlete {} (minutes)".format(bib_number))plt.title("Normalized Cumulative Race Times")plt.xticks(rotation=45)plt.tight_layout()plt.grid(True, linestyle='--', alpha=0.5)plt.show()
This is better, as we can see that there are a lot of curves where I am faster than on the bike, then gaining on me during the run, and similarly times when getting off the bike and taking off out of T2.
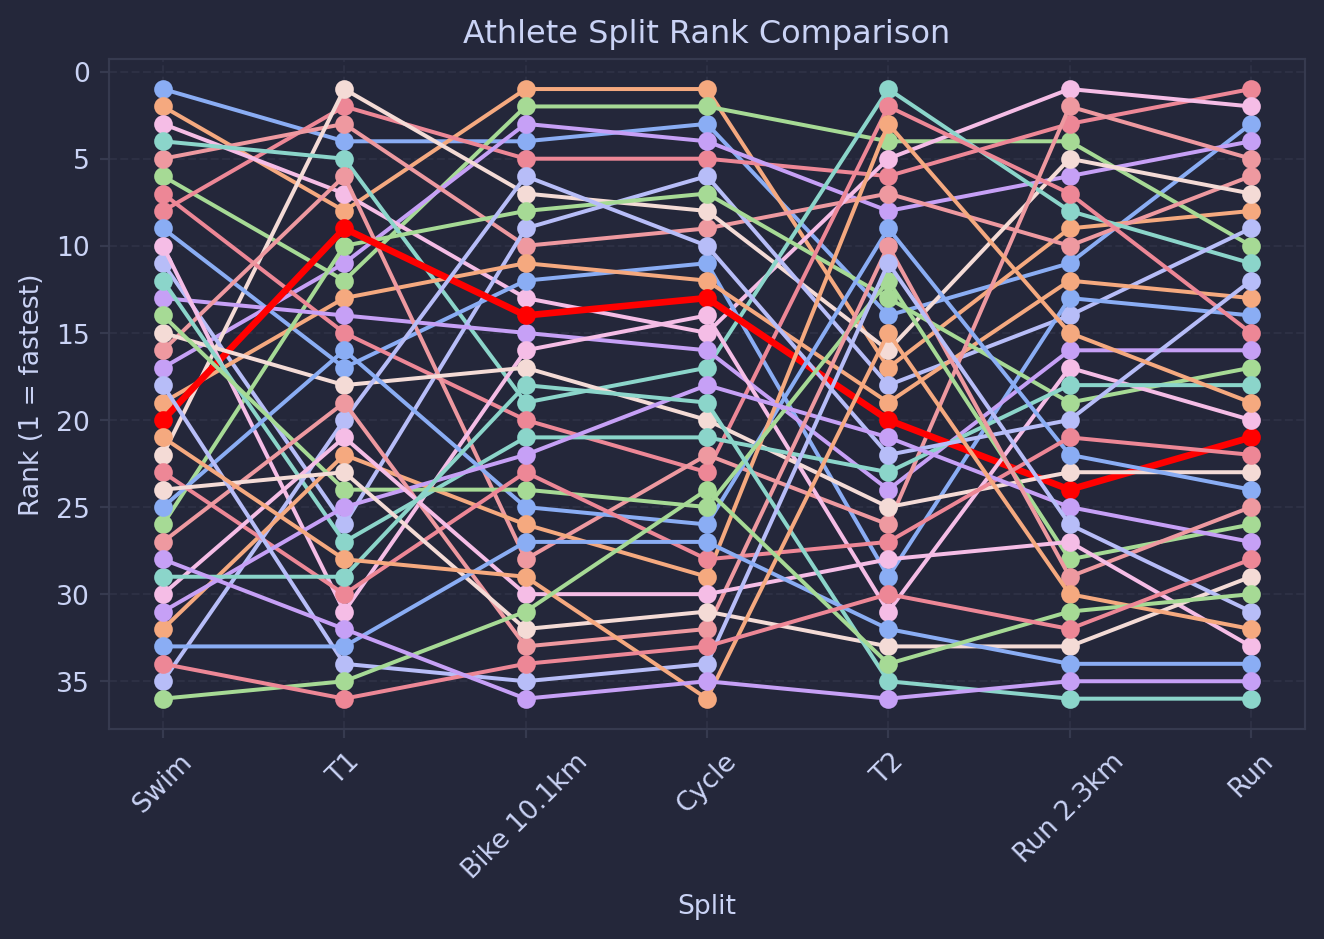
Something that I think could be usefull is looking at how I ranked in each section, because that is what it means to be ‘average’ after all.
Code
# Split names (exclude 'Start')locations = [entry["Location"] for entry innext(iter(results.values())) if entry["Location"] !="Start"]# Compute split times for each athlete, **only keep complete athletes**athlete_splits = {}for athlete_id, splits in results.items(): times_sec = [to_seconds(entry["Race Time"]) for entry in splits]# skip incomplete or malformed dataifNonein times_sec orlen(times_sec) !=len(splits):continue# compute split times (diff of consecutive times) splits_sec = [times_sec[i] - times_sec[i-1] for i inrange(1, len(times_sec))]# skip athletes without full set of splitsiflen(splits_sec) !=len(locations):continue athlete_splits[athlete_id] = splits_sec# Convert to numpy array for rankingall_splits = np.array([splits for splits in athlete_splits.values()]) # shape: athletes x splits# compute ranks per split (1 = fastest)ranks = np.argsort(np.argsort(all_splits, axis=0), axis=0) +1athlete_ids =list(athlete_splits.keys())# plot rank per splitplt.figure()for i, athlete_id inenumerate(athlete_ids): plt.plot(locations, ranks[i], marker='o', label=athlete_id, linewidth=2.5if athlete_id == target_id else1.5, color='red'if athlete_id == target_id elseNone)plt.gca().invert_yaxis() # rank 1 at topplt.xlabel("Split")plt.ylabel("Rank (1 = fastest)")plt.title("Athlete Split Rank Comparison")plt.grid(True, linestyle='--', alpha=0.5)plt.xticks(rotation=45)plt.tight_layout()plt.show()
And here we can see that, as I expected, average swimmer, good biker, bad runner, though not as bad as I thought I was (I was getting passed a lot). It’s crazy to me, my performance on T1, but maybe I am just good at putting on shoes real quick.
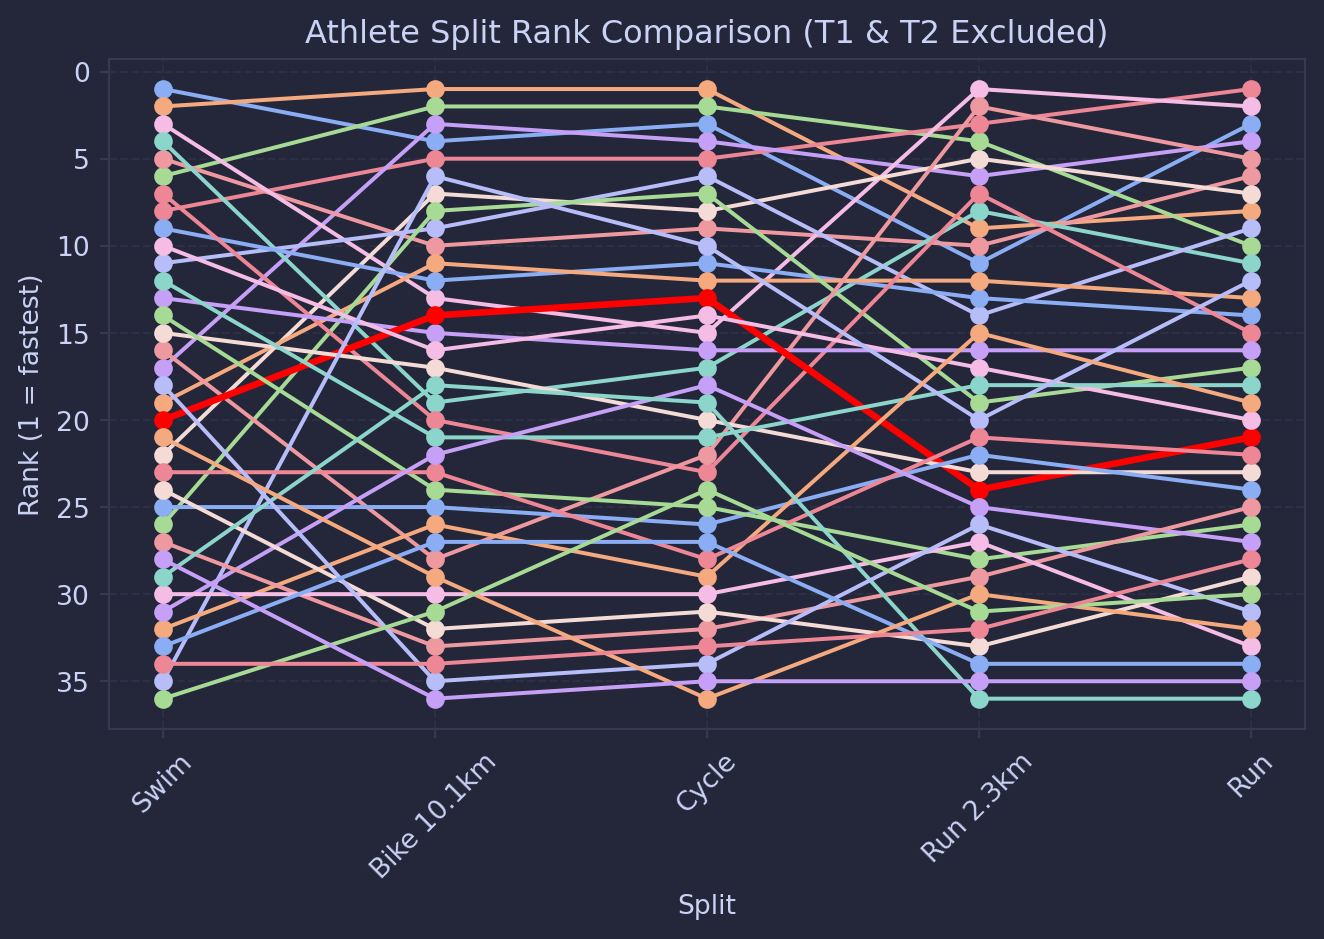
Because it is noisy, I’ll remove T1 and T2 from the chart to see if there are any cool athletes that just killed it in one discipline.
Code
# Split names (exclude 'Start', 'T1', 'T2')locations = [ entry["Location"] for entry innext(iter(results.values())) if entry["Location"] notin ("Start", "T1", "T2")]# Compute split times for each athlete, only keep complete athletesathlete_splits = {}for athlete_id, splits in results.items(): times_sec = [to_seconds(entry["Race Time"]) for entry in splits]# skip incomplete or malformed dataifNonein times_sec orlen(times_sec) !=len(splits):continue# compute split times (diff of consecutive times) splits_sec = [times_sec[i] - times_sec[i-1] for i inrange(1, len(times_sec))]# keep only splits corresponding to locations (exclude T1 and T2) split_names = [entry["Location"] for entry in splits][1:] # first diff corresponds to index 1+ filtered_splits = [t for t, loc inzip(splits_sec, split_names) if loc in locations]# skip athletes without full set of splitsiflen(filtered_splits) !=len(locations):continue athlete_splits[athlete_id] = filtered_splits# Convert to numpy array for rankingall_splits = np.array([splits for splits in athlete_splits.values()]) # athletes x splits# compute ranks per split (1 = fastest)ranks = np.argsort(np.argsort(all_splits, axis=0), axis=0) +1athlete_ids =list(athlete_splits.keys())# plot rank per splitplt.figure()for i, athlete_id inenumerate(athlete_ids): plt.plot( locations, ranks[i], marker='o', linewidth=2.5if athlete_id == target_id else1.5, color='red'if athlete_id == target_id elseNone, label=athlete_id if athlete_id == target_id elseNone# only label target )plt.gca().invert_yaxis() # rank 1 at topplt.xlabel("Split")plt.ylabel("Rank (1 = fastest)")plt.title("Athlete Split Rank Comparison (T1 & T2 Excluded)")plt.grid(True, linestyle='--', alpha=0.5)plt.xticks(rotation=45)plt.tight_layout()plt.show()
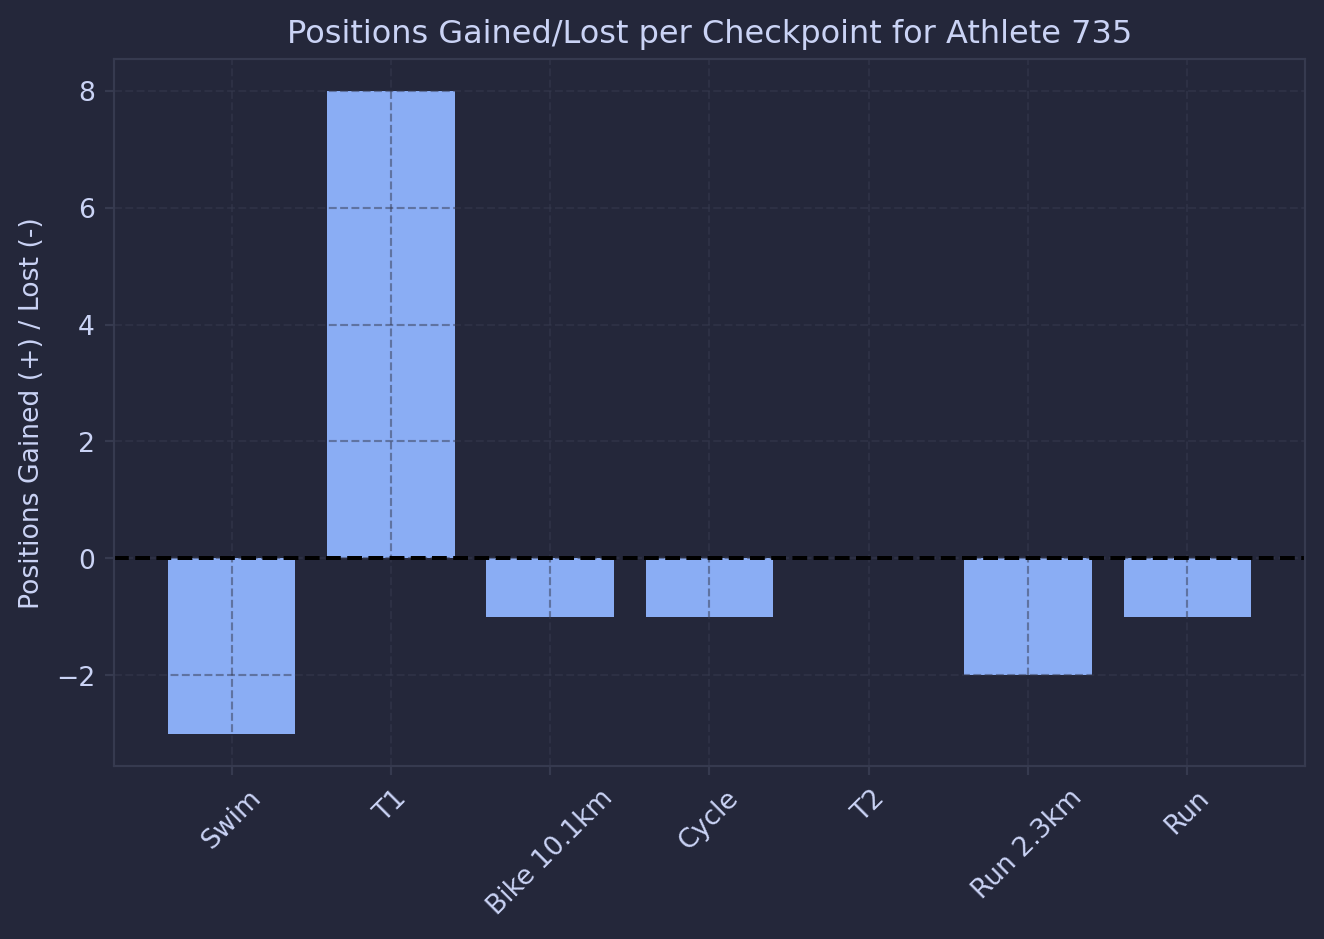
Finaly, because this is a race, lets see where I gained and lost positions:
Code
locations = [entry["Location"] for entry innext(iter(results.values()))]# Collect cumulative times, **only complete athletes**athlete_times = {}for athlete_id, splits in results.items(): times_sec = [to_seconds(entry["Race Time"]) for entry in splits]ifNonein times_sec orlen(times_sec) !=len(locations):continue# skip incomplete athletes athlete_times[athlete_id] = times_sec# Convert to numpy arrayathlete_ids =list(athlete_times.keys())all_times = np.array([athlete_times[aid] for aid in athlete_ids]) # now all rows same length# Compute ranks at each checkpoint (1 = fastest)ranks = np.argsort(np.argsort(all_times, axis=0), axis=0) +1# Target athlete indexif target_id notin athlete_ids:raiseValueError(f"Target athlete {target_id} not in complete data")target_idx = athlete_ids.index(target_id)target_ranks = ranks[target_idx]# Compute overtakes (change in position vs previous checkpoint)overtakes = np.diff(target_ranks) # +ve = lost, -ve = gained# Plot overtakes per checkpointcheckpoint_labels = locations[1:] # diff reduces one elementplt.figure()plt.bar(checkpoint_labels, -overtakes) # invert so positive = positions gainedplt.axhline(0, color='black', linestyle='--')plt.ylabel("Positions Gained (+) / Lost (-)")plt.title(f"Positions Gained/Lost per Checkpoint for Athlete {bib_number}")plt.xticks(rotation=45)plt.grid(True, linestyle='--', alpha=0.5)plt.tight_layout()plt.show()
So after coming out of the water middle of the pack, I gained a heap of spots in T1 and then just held on for the rest of the race? The data says so, but it didn’t feel like that.
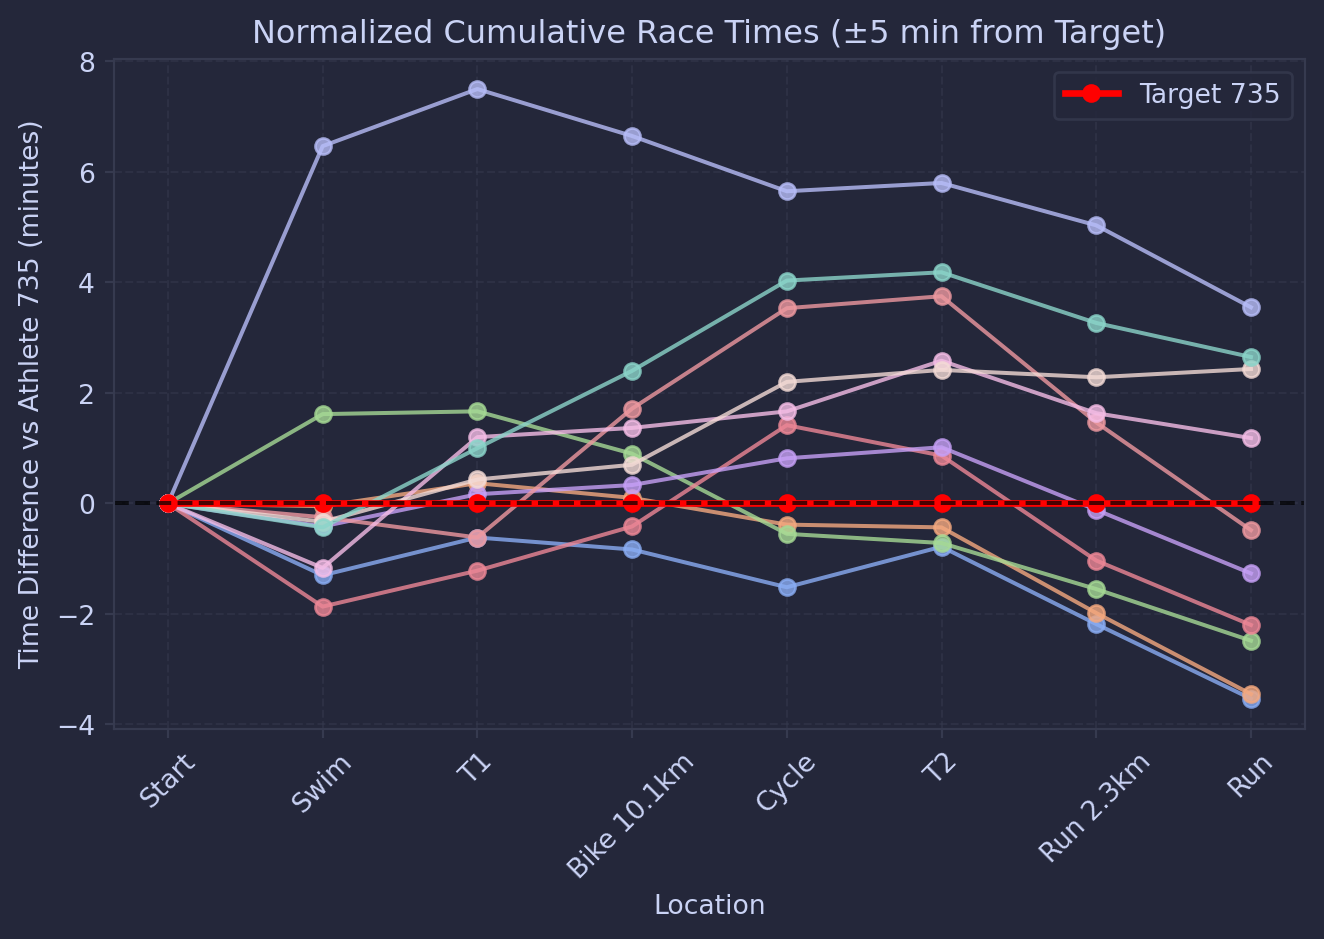
So lets compare to athletes that finished around the same time as me (+- 5 mins)
Code
# split locations (exclude T1/T2 if desired)locations = [entry["Location"] for entry in target_splits]# target athlete cumulative timestarget_dict = {entry["Location"]: to_seconds(entry["Race Time"]) for entry in target_splits}ifany(loc notin target_dict or target_dict[loc] isNonefor loc in locations):raiseValueError(f"Target athlete {target_id} does not have complete data")target_times = [target_dict[loc] for loc in locations]target_final_time = target_times[-1]# Catppuccin paletteplt.figure()for athlete_id, splits in results.items():# skip target athlete (we’ll plot separately)if athlete_id == target_id:continue# convert athlete cumulative times loc_time_dict = {entry["Location"]: to_seconds(entry["Race Time"]) for entry in splits}ifany(loc notin loc_time_dict or loc_time_dict[loc] isNonefor loc in locations):continue times_sec = [loc_time_dict[loc] for loc in locations]# filter: only within ±5 minutes of targetifabs(times_sec[-1] - target_final_time) >5*60:continue# normalize: difference vs target in minutes times_norm = [(t - t_target)/60for t, t_target inzip(times_sec, target_times)]# plot with Catppuccin color plt.plot(locations, times_norm, marker='o', linewidth=1.5, alpha=0.8)# plot target athlete in redplt.plot(locations, [0]*len(locations), marker='o', color='red', linewidth=2.5, label=f"Target {bib_number}")plt.axhline(0, color='black', linestyle='--', alpha=0.7) # baseline at targetplt.xlabel("Location")plt.ylabel(f"Time Difference vs Athlete {bib_number} (minutes)")plt.title("Normalized Cumulative Race Times (±5 min from Target)")plt.xticks(rotation=45)plt.grid(True, linestyle='--', alpha=0.5)plt.legend()plt.tight_layout()plt.show()
And this tells a different story. To my closest competitors, I did in fact swim slightly below average, then had a ripper of a T1 and bike to gain places on them, before all of them bar one ran it in faster than me.